I consider myself a fledgling geometer. That is, someone who is inspired by the beauty in numbers and wants to make stuff in that realm. Geometric images and like that. Some call it Sacred Geometry. I prefer to call it Inspired Geometry. So, I’m an Inspired Geometer? Okay. I can go with that.
For many months now, I have been studying and playing with transforming numbers into pictures. I’ve been using a programming language called R. It is an astonishingly powerful tool. I started out being interested in using it to wrangle datasets around. I’m fascinated with big data, like many others these days. But then I discovered the expressive capacity to make art. I’m hooked. Shall I call it aRt?
Besides being free, one of the benefits of R is that if is supported the world over and contains a huge depository of libraries that people have contributed that extend the capacity of R to do all sorts of things. Many are mundane. Many are wild and wonderful.
A man named Zuguang Gu has created a huge library package call circlize that takes numeric data and creates visualizations in the circular. It is an astonishing achievement IMHO.
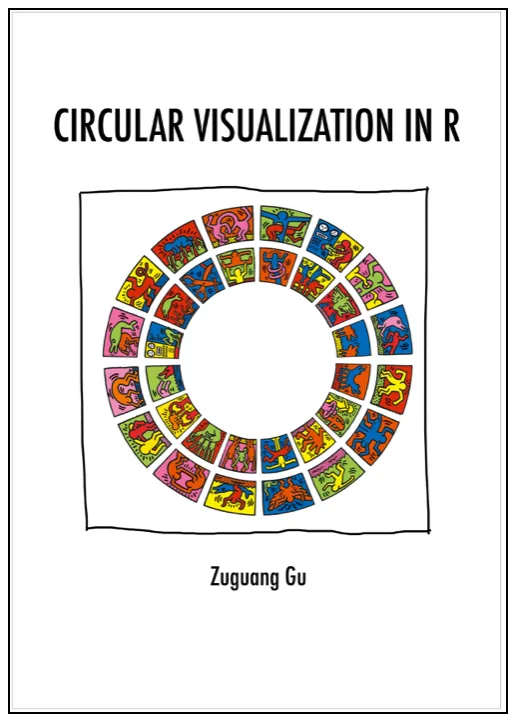
If you’re inclined, you can learn more about it HERE. And you can learn more about R HERE.
I could get lost in this package alone for years, but I’ve much else to do, eh? So when I found out that I can transform a simple matrix into a circular geometric shape, I quickly fell in love with the possibilities.
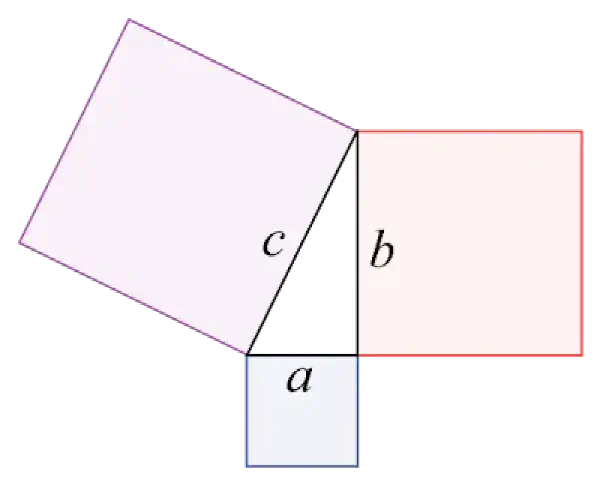
In it’s simplest form, a matrix is a rectangular array of numbers arranged in rows and columns. Here is a 2 x 3 matrix of random numbers.

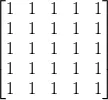
In R, you can create a 5 x 5 matrix consisting of the number 1 like this:
matrix(1, 5, 5) It would look something like this:
The simplest one line R program to generate a visualization of this using the circlize library, might look like:
circlize::chordDiagram(matrix(1, 5, 5)) Amazingly, this one line program generates this image:
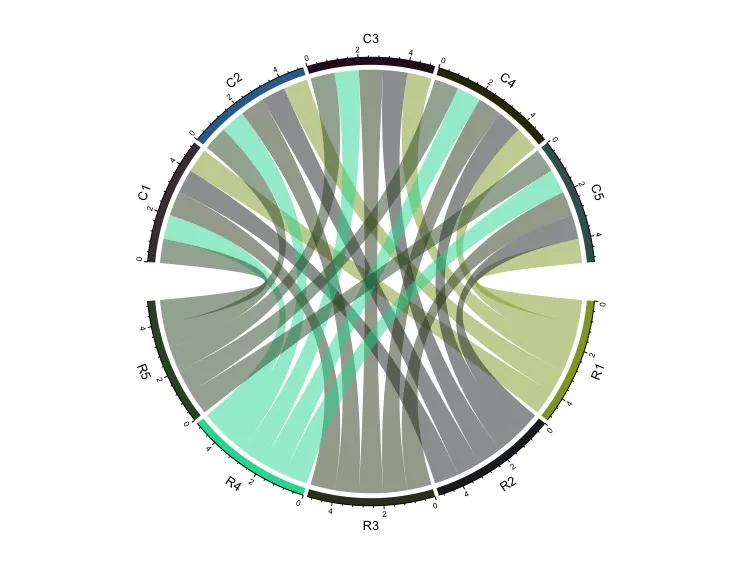
This is because circlize appends a lot of default properties to its use. In order to get to something much simpler that I liked:
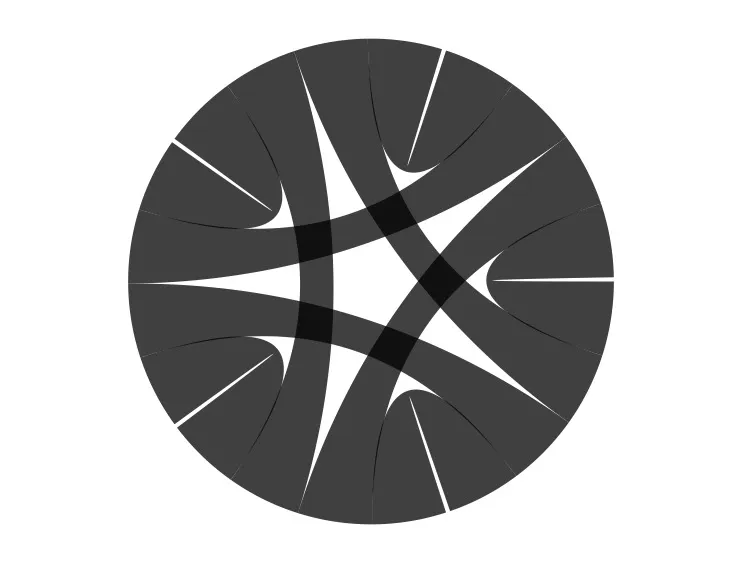
I had to add more to the program, writing this:
par(mar = c(1, 1, 1, 1), bg=“white”) circlize::chordDiagram(matrix(1, 5, 5), col=“black”, symmetric = TRUE, transparency = 0.25, annotationTrack = NULL)
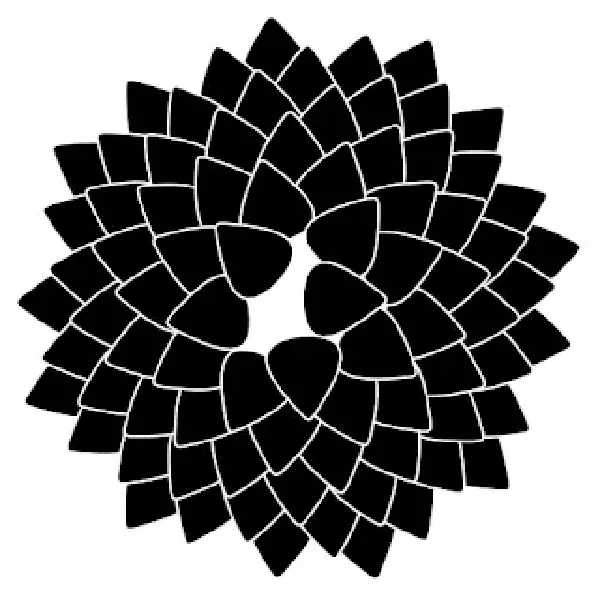
I spent weeks experimenting with colors, transparency and values to get to this point:
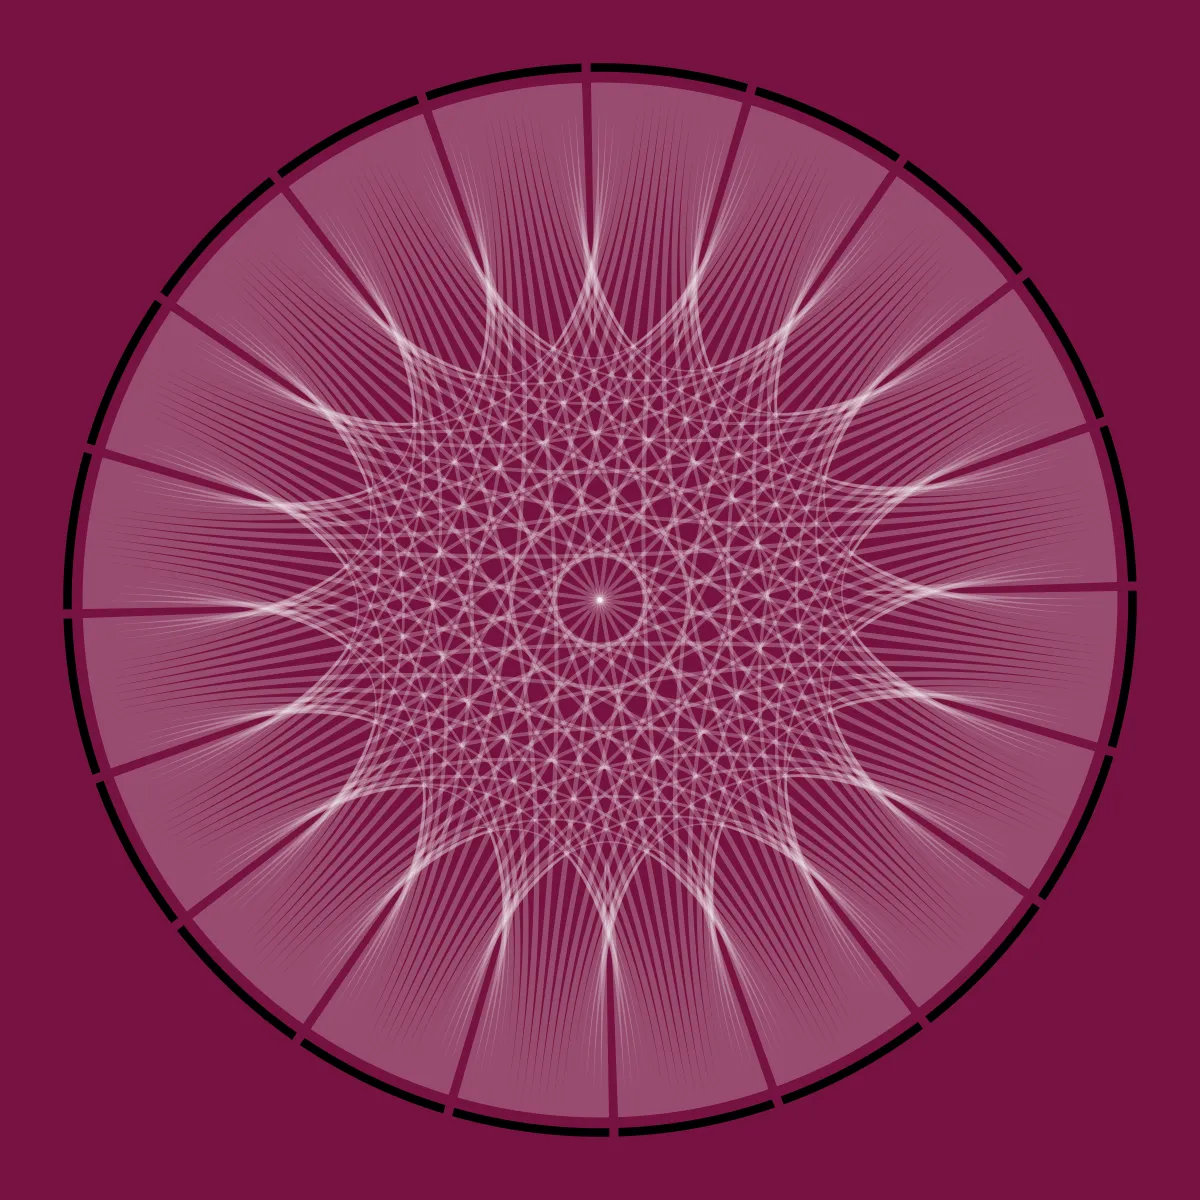
Next I want to transfer some of these images onto a canvas with oils. Then, make animated movies.